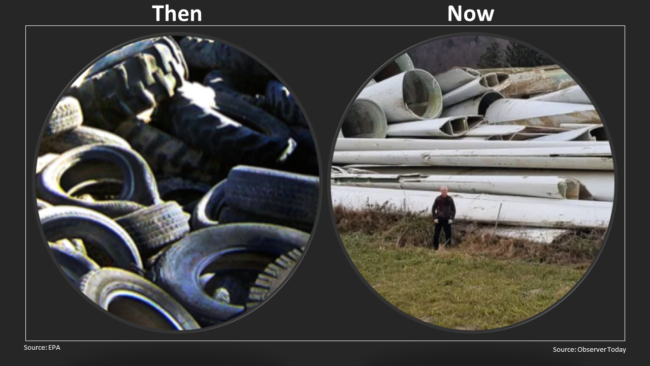
Tag: energy basket

  • A Windy Position

    A Windy Position

    In a recent online discussion, this pundit put forth the thought that fiberglass wind turbine blades can pose an environmental problem when decommissioned.  This position was quickly challenged with the rebuttal that burning coal ‘kills’ kids so it did not matter if discarded blades litter the countryside as it is worth it.

    According to research quoted by the European Wind Energy Association, “With wind turbine blades likely to account for some 50,000 tons of waste annually by 2020, growing 4 times by 2034 the landfill is not a viable long-term solution.”  Moreover, “Findings from the University of Strathclyde indicate a global increase of wind turbine blade waste from around 400,000 tons per annum in 2030 to around two million tons by 2050.”

    My rebuttal to the kills kids argument–what will this do to global population health?  Keep in mind, this is only one source of industrial (and consumer, i.e., EV automobiles) decommissioned assets.

    Disposal/Recycling

    “Glass-reinforced polymer composites (GRP), used in wind turbine blades around the world, is recognized as a hard-to-break-down source of pollution.”  Research is underway to address this problem and mostly likely progress will continue going forward.

    “Currently only a few recycling techniques are available to treat such an enormous quantity.  So most have been landfilled and many continue to be buried today.”  Other current options include:

    • Grinding–turning fiberglass into powder.  A labor intensive process that provides filler for other purposes
    • Incineration–the ash is usually disposed of in a landfill
    • Pyrolysis–decomposes into three recoverable substances: pyro-gas, pyro-oil, and solid byproduct— all of which can be recycled

    “While the overall life of the wind turbine does cause less pollution than coal-fired power plants do, the initial solution of just burying the fiberglass doesn’t seem in line with the goal to cause less pollution.” (Ibid)

    Really?  How is this saving the planet?

    Clearly, these alternative disposal processes have a financial cost greater than simply burying the blades.  If not, they would be used more frequently.

    Future generations will have to address this issue much like the current one continues to deal with asbestos from the past.  The KIDS will end up dealing with and paying for the folly of their parents and grandparents.

    A Contrarian Posture

    As noted, there is a romanticism about renewable energy sources, most commonly wind and solar.  However, we believe in the ‘no free lunch’ model.  There are risks and cost associated with every form of energy.

    In two recent editions, Heavy Metal Rocks and Going Green? Or NOT! we took an initial look at the financial cost over the renewable lifecycle as well the environmental impact that will need to be addressed.  The edition is a continuation of the premise that, “Technology Romance must be met with Fiscal Realities.”

    Society will eventually recognize the environmental damage done by solar and wind energy systems can be very high.  By then, the harm may have been done.

    As an example, many oil and gas assets are approaching end of life.  The decommission costs are very high and increasingly regulations are changing to hold asset owners accountable for these costs.  Generally, accountants refer to these as Reserves.

    Shouldn’t renewable asset holders be required to set aside reserves to cover the disposal of assets as well?

    Lifecycle Cost Structure

    For capital assets with significant planning, development, manufacture, deployment, operations & maintenance and finally decommissioning costs there is another dimension.  The Asset Maturity Model was developed to assist management understand how to best maximize asset performance over decades, in some cases.  This model is integrated into an economic value model which we be discussed herein.  There are also a number of tools and standards available to assist management, such as ISO 55001–Asset Management.

    In April 2022, Bloomberg published a piece, “Wind Power’s ‘Colossal Market Failure Threatens Climate Fight.”  The Global Wind Energy Council deemed the current wind energy situation a ‘Colossal Market Failure.’

    Blaming a mismatch (alignment) between governments policies and current markets, the risk is not only that net zero targets will not be met but the supply chain is contracting.  Moreover, one study suggests that for the US net-zero policies will cost more than 12% of our Gross Domestic Product (GDP) in 2050.  To put this in perspective, today Social Security cost 5% of GDP and Medicare/Medicaid 6.4 percent–11.4% combined.

    The ‘lack of alignment‘ is a major determent to successful organizations.  In our recent blog, ESG Explained we discussed the role organization and its ecosystem governance at length.  Building on our 2011  monograph, Asset/Equipment Integrity Governance: Operations–Enterprise Alignment; A Case for Board Oversight (AEIG) we developed the case for Operational Excellence as part of ESG.  Energy and supply chain management are key components of this enterprise approach.

    Total Cost of Ownership (TCO)

    TCO is a function of the acquisition cost, including all engineering, design, deployment, installation etc. as well as ALL costs associated with its lifecycle OPEX, including decommissioning, abandonment, and environment remediation.  It is all encompassing.  It is the long-standing metric that all projects must understand and model accordingly before a Capital Expenditure (CAPEX) is authorized.

    The following list are documented per citation links.  These are taken from a recent article challenging the Return on Investment (ROI) of current green initiatives.

    Readers will note that some are social costs, i.e., transition costs to new energy sources currently provide minuscule contributions to the Energy Basket.  These costs will grow dramatically going forward.

    •  “Making a transition from fossil fuels to green energy is costly.  Solar and wind can only deliver electricity, which accounts for less than a fifth of total energy consumption.
    • When the sun doesn’t shine or the wind doesn’t blow, prices rise quickly and we have to revert to fossil fuels for backup.
    • Batteries are inadequate and expensive, easily quadrupling solar electricity costs and failing to provide much power.
    • In 2021, Europe only had battery capacity to backup less than 1 ½ minutes of its average electricity usage.  By 2030, with 10 times the stock of batteries, and somewhat more usage needed, they’ll have enough for 12 minutes.
    • The Bank of America has found that achieving net-zero will cost $150 trillion over 30 years, almost twice the combined annual GDP of every country on Earth.
    • The annual cost of $5 trillion is more than all the world’s governments and households spend every year on education.
    • In a new study, McKinsey finds most of the poorest nations in Africa would have to pay more than 10 percent of their total national incomes every year toward climate policy.  This is more than these nations combined spend on education and health.
    • Reducing emissions just 80% will cost the United States more than $2.1 trillion every year from 2050, or more than $5,000 per person, per year.
    • The annual US cost of World War II is estimated at $1 trillion in today’s money.  Every year by 2050, climate policy could cost Americans more than twice what they paid during the Second World War.
    • Surveys show few people are willing to spend more than a few hundred dollars a year on climate policies.  Asking people to spend tens or hundreds times more is a recipe for failure.”

    These are significant tangible and intangible costs.  In this writer’s opinion, the business case has not been made for these and other total cost line items.  A more extensive study should be considered by readers who want to do a deep dive on these economics.

    Keep in mind, that these broader issues do not take into consideration regarding daily operations and maintenance.  These must be factored in as well.

    Finally, while these are ‘opinions’ from reputable sources, why are they not considered the economic models used today?  Seems like Data Bias, doesn’t it.

    EVPM

    Beginning in 2004, recognizing many of the TCO components as well as the economic value potential from a CAPEX, we developed what came to be known as our Economic Value Proposition Matrix model (EVPM).  This model is now mature, robust as well as integrating a Risk Matrix.

    It is an excellent tool for assessing both Tangible and Intangible components of value and cost.  Additionally, a free version is available and it is fully supported with training as well as other materials (including a video).

    Importantly, EVPM “Translates technology into the Language of Business” which make it an excellent tool for preparing to meet with the Chief Financial Officer (CFO) and/or Budget Committee.  Management makes decisions as a function of the risk associated economic value brought to the organization.  While technology has a level of romance to it, financial issues are the major decision making driver.

    The Energy Basket

    It is useful to look past the hype to see what the US energy basket actually looks like.   Slightly over three percent comes from wind and only 1.3 % is solar.  Fossil fuels (petroleum natural gas and coal) represent 79% of our current energy consumption.  In the opinion of this writer these disparities have been basically the same for decades.

    China and India burn 14 million tons of coal per day!  By all accounts, coal will play a major role in power production in these economies for some time to come.  As a function of the global percentage of coal used; China over 50%, India over 11% and the United States at approximately 8.5%.  Moreover, an assessment of its use by 130 countries is available to interested readers.

    The debate about ‘Clean Coal‘ continues.  None-the-Less, most likely coal will continue to be used for decades.  Keep in mind that 2050 is less than 28 year away.

    While regulation plays a role in the energy mix, economics are the fundamental driver.  Until the economics of non fossil fuels change, the basket will most likely not.

    The Lone Ranger is Missing

    Listening to some, it seems that all we have to do is focus on the Energy Transformation and in only a few short years magic will happen.  Hate to tell everyone, there is no Silver Bullet.  Transformation will take decades and should be led by those driven by market forces.

    One example, on April 29, 2022 the Texas Department of Transportation (TxDot) announced the two year closure of a major highway artery in the Houston metropolitan area to replace a concrete ramp.  Point being, road construction is well understood and a major proven technology and process.  Still, it will take a significant amount of time to perform this upgrade.

    How can we assume a major Energy Transformation using new technologies will unfold as optimistic parties suggest?  History suggests this is not likely.

    Closing Points

    This long time energy careerist believes that various energy sources from the basket should be used as economically appropriate.  While we all have an interest in a low pollution environment, if the economics as shown in this piece are close to correct, the resulting economic damage may be greater than a somewhat warmer planet.

    The data presented herein are documented.  The sources and quality of the data can be challenged but it should not be ignored.

    Finally, this piece has focused primarily on wind energy.  A similar analysis needs to be taken for every energy source including fossil fuels of all kinds.

    The demand for energy will continue to grow and even exponentially.  Clean fossil fuels are available and without strong energy balanced policies the future is bleak for many and not just because of climate change by the significantly higher cost of living and loss of opportunities due to energy starvation.

    The energy challenges are complex and dynamic.  This blog is not a comprehensive review, but simply a focus on a narrow aspect.  For example, we did not delve into issues such as Carbon Capture & Sequestration.  A calm, rational, economics discussion is in order.

    What does Energy Transition mean to you and how will you help the Less Fortunate be better off?

    For More Information

    Please note, RRI does not endorse or advocate the links to any third-party materials.  They are provided for education and entertainment only.

    For more information on Cross Cultural Engagement, check out our Cross Cultural Serious Game.  You can contact this author as well.

  • Will Price Controls Work This Time?

    Will Price Controls Work This Time?

    Update: Just after we published this edition, Goldman Sachs released this comprehensive research piece; Stagflation Risk.

    Recently, one media outlet raised the suggestion of government price controls.  Generally, seen as a bad idea, none-the-less in this inflationary environment, some may perceive value from an action of this kind.

    Additionally, in the current environment some politicians favor cancelling the gasoline tax at both the state and federal levels.  This might beg the question, if these taxes can be abated, why are they in place anyway?

    In 1971, President Nixon implemented price and wage controls.   Some saw this as an election ploy and if so, it worked as he was reelected.  In 2008, the free market Republican George W. Bush stated that sometimes you have to, “abandon free‐​market principles to save the free‐​market system.”  WHAT?

    Elected politicians often think they know more about running companies and economies than those who actually do.  Printing money and regulating commercial processes that they know nothing about, usually in the name of the people who may have put them in office.  Since most of these individuals do not have a working knowledge of the economy, is it any wonder that they bugger things up when they insert themselves?

    And Now!

    Self imposed, inflation is now higher than it has been since the 1970s.  Blamed on a third world country invading its neighbor, leadership states, I “can’t do much” about gasoline prices.  Need I say, malarkey!  The world is awash with ‘clean’ fossil fuels; societies just choose not to use them effectively.

    The concept of an Energy Basket is well defined and depending on geographical location, and need requirements any or all can be used as economically feasible.  Moreover, the concept of Energy Transition is not new.

    In  1993,  Theodore Modis published this diagram in his peer reviewed work, Technological Substitutions in the Computer Industry whereby he presented a technology substitution model that both energy and silicon mapped to very well.

    While renewables were not included in the model, readers will get the point that energy transition has always been an on going process.

    We further discussed this process in our 2015 book, Structural Dynamics: Foundation of Next Generation Management Science.  We defined, Structural Dynamics “the morphology or patterns of motion towards process equilibrium of interpersonal systems.”  In other words the nexus of structure and process whereby markets seek equilibrium if only for a time.

    Markets drive technology substitution.  Only when the economics of new energy sources are acceptable does the ‘take up’ move quickly.

    Volckerism

    Tough Love by the Fed kicked Stagflation in the gut and yes it hurt the US economy for years, but it saved the country from a worse fate.  From the Federal Reserve Bank of St. Louis, “On Oct. 6, 1979, Fed Chairman Paul Volcker took dramatic steps to rein in the runaway inflation that had been sapping the strength of our economy since the mid-1960s.  Without his bold change in monetary policy and his determination to stick with it through several painful years, the U.S. economy would have continued its downward spiral.  By reversing the misguided policies of his predecessors, Volcker set the table for the long economic expansions of the 1980s and 1990s.”

    In 1965, the inflation rate was one percent.  By 1980, it had hit 14 percent.  Per Chairman Volcker’s statement, both Nixon and Carter implemented price controls with catastrophic effects on the nation.

    The Heavy Hand

    This  is not a piece on fiscal or monetary policy, rather it is meant as a wake up call from someone who lived through that period.  Distorted markets always correct, often rapidly and harshly.  The Great Depression comes to mind as well, as the Dotcom Bubble, Financial Crisis of  2008, etc.

    Those interested in the details and theory of human behavior in this period can follow up with the cited materials as well as a wealth of knowledge on  the subject of price controls.

    Bottom line, price controls did not work.  Markets became distorted.  Moreover, easy credit (very low interest rate) transformed to expensive credit (high interest rate) and eventually this painful process negatively transformed the marketplace in ways most contemporary readers have never known their whole life.

    Price controls are tempting.  It is easy to say, lets stop corporations from making obscene profits or gouging.  However, the downside negatively impacts those who need economic help the  most.

    One expects that in the coming months, especially as the election nears calls for price controls will become louder.  History has shown the results of such actions as economic suicide.

    How will your company prepare for mandated price freezes?

    For More Information

    Please note, RRI does not endorse or advocate the links to any third-party materials.  They are provided for education and entertainment only.

    For more information on Cross Cultural Engagement, check out our Cross Cultural Serious Game.  You can contact this author as well.

    References:

    Modis, Theodore. (1993). Technological Substitutions in the Computer Industry. Technological Forecasting and Social Change. 43. pp. 157-167.

  • Going Green? Or NOT!

    Going Green? Or NOT!

    The total or lifecycle carbon footprint for any energy source is a function of the manufacturing, commissioning, operation (including maintenance) and decommissioning of that asset.  Moreover, the value of an electric powered vehicles (EV) is seen as a function of the amount of fossil fuel no longer used by the vehicle.  However, this is only a sub-model of the to carbon footprint of any component in the Basket of (Energy) Goods, aka Energy Basket.

    All energy resources in the basket must be held to the same set of metrics.  These include Human Resources (including diversity and inclusion), Safety Culture, communities as well as the bottom line performance against governance standards (ESG).

    Risk Governance

    A governance framework that exceeds these standards follows.  Evolving over several decades, it reflects a comprehensive approach to operational risk that is often overlooked.  It addresses the entire life of a revenue producing asset.

    Lifecycle risk mitigation of an energy resource must include the end of the asset life processes.  What governance driven processes are in place to prevent the accumulation of wind turbine blades or spent solar panels stacked and abandoned?  Just like the tires stacked for decades.

    Turns out the answer is few.  Long life assets such as factories, skyscrapers, fossil fuel production systems, etc. are built to the engineering, industry and local regulatory standards of that day.  Ongoing operations, maintenance, upgrades and so forth keep them performing at acceptable levels.  However, governance models are often focused on the present.  End of asset life risk does not fit into the four quarter management mindset as the event may be sometime in the future.

    The above graphic represents a governance model built around operations and associated risks.  The archetype recognizes that many risk mitigation processes are inadequate for today’s complex organizations with multi-faceted global processes.

    Its framework is built upon the work done by the Treadwell Commission several decades ago to detect financial fraud.  This structure supports the extension into field operations and provides a structure for attaining and sustaining Operational Excellence.

    Risk mitigation is both quantitative and qualitative.  The risk associate with the use of any industrial energy source must be thoroughly assessed as a function of its lifecycle, not just its initial CAPEX and ongoing operations.

    Dumping v Decommissioning

    Illegal industrial dumping has long been a problem.  Today, some in the wind turbine sector appear to be following the decades long vehicle tire disposal process (or lack thereof).

    Lady Bird Johnson at least tried to hide the piles of tire debris but no one has found a way of completely dealing with this growing and massive problem.  As of 2017, some 17% were still disposed of in landfills.  In 2003, the EPA reports that almost 300 million tires are scraped each year.  Flash forward to today and this is likely a very conservative number.  That said, 17% equals approximately 50 million tires headed to landfills as opposed to recycling.

    Moreover, there is a long history of industrial dumping trash so as not to have to pay the disposal fees.  One wonders how many millions of tires destined for landfills (and other recycling) are just dumped?

    The decommissioning process is the responsible end-of-asset-life shutdown and removal.  The intent is to return the site to a condition similar to its initial environment and properly remove and dispose of equipment and materials.  It should not include stacking wind turbine blades next to a pile of discarded vehicle tires.

    Total Carbon Lifecycle Model

    Daily, we hear about the need to reduce carbon output to (net) zero.  Promises are made by many that by such and such a time this metric will be met.  Caveat: usually the time period is beyond the expected tenure of those making the statements.  Often lost in the discussion is the carbon cost of manufacturing and decommissioning.

    Carbon output should include the mineral extraction process, recycling of older materials if appropriate, transportation, manufacturing, installation, operations and decommissioning.  It also must include the carbon cost of the supply chain necessary to support the asset across its lifecycle.  For example, the carbon cost of an EV is not just the vehicle’s operation but the lifecycle of the vehicle as well as the electric power generation and distribution necessary to operate the automobile.  Do not forget the carbon cost of manufacturing a battery and disposing of it at end of life.

    Scrap

    Materials are often staged for recycling.  They feed a process that results in new useful product(s) that may add new value.  This is a useful recycling process that makes a lot of sense.  However, sometimes this is not as economical as new manufacturing.  These economics lead to dumping as the low-cost-solution.  Fields of discarded materials may or may not be awaiting recycling.

    Defining Green

    Being green is not simply using renewable electricity instead of gasoline.  If the carbon footprint is no different or even worse, then the problem is not solved and may even be made greater.

    Keep in mind that coal is still a major fuel in the generation of electricity.  According to the US Energy Information Administration (EIA), in 2020 over 60% of power is generated using fossil fuels of which over 19% is from coal.  This does not include the carbon footprint of materials and products imported to the US.

    So if the carbon footprint of a wind turbine is defined as its lifecycle and if at the end result is abandonment in a field, is the green value of that product positive?  Or is it just dumping not unlike the pollution of a nation’s river systems?

    Being green is not just plugging in your car overnight.  Like most things in life, it is systemic.

    Is Your Organization’s Green Plan Systemic or Myopic?

    For More Information

    Please note, RRI does not endorse or advocate the links to any third-party materials.  They are provided for education and entertainment only.

    For more information on Cross Cultural Engagement, check out our Cross Cultural Serious Game

    We presented, Should Cross Cultural Serious Games Be Included in Your Diversity Program: Best Practices and Lessons Learned at the Online Conference, New Diversity Summit 2020 the week of September 14, 2020.  Check Out this timely event and contact the organizer for access to the presentations!!

    For more on DEI Standards, see the newly released ISO-30415.

    You can contact this author as well.